They surpass U.S. public in valuing marriage, parenthood and hard work
By Molly Rohal and Vidya Krishnamurthy – Pew Research Center
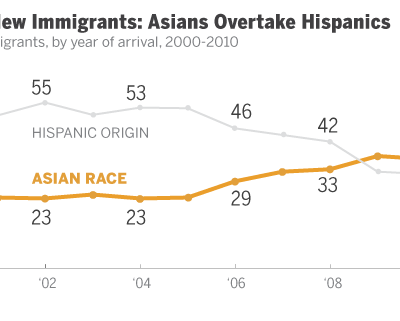
Asians have overtaken Hispanics as the largest group of new immigrants arriving each year in the United States, according to The Rise of Asian Americans, a comprehensive new Pew Research Center survey and report. Two-thirds of recent adult Asian immigrants are either college students or college graduates – and they have helped make Asian Americans the fastest-growing, highest-income and best-educated racial group in the United States. The survey finds that Asian Americans are more satisfied than the general public with their own lives and the nation’s direction, and they place a higher value on marriage, parenthood, hard work and career success.
Asian Americans now make up 5.8% of the nation’s population, up from less than 1% in 1965, when the modern immigration wave from Asia began. In 2010, 36% of new immigrants to the U.S. were Asian, up from 19% in 2000. The share of new immigrants who were Hispanic in 2010 was 31%, down from 59% in 2000.
Nearly six-in-ten (59%) of the nation’s 18.2 million Asian Americans – and 74% of all Asian-American adults – are immigrants themselves; the rest are descendants of immigrants from dozens of countries in Asia, each with a unique culture and history.

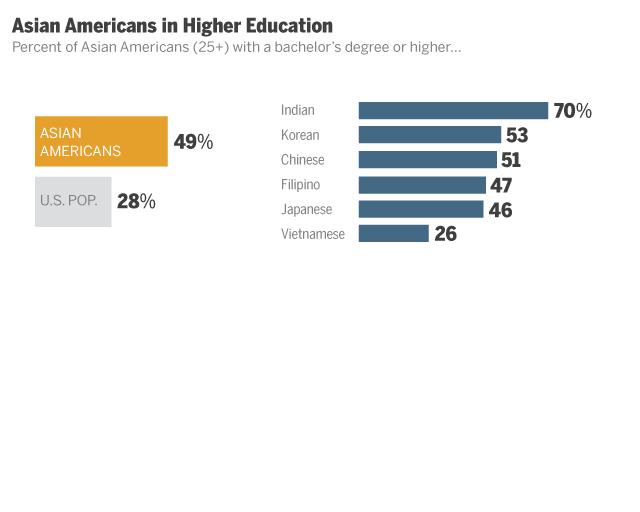
Despite often sizable differences among these subgroups, Asian Americans are distinctive as a whole, especially when compared with all U.S. adults, whom they exceed not just in the share with a college degree (49% vs. 28%), but also in median annual household income ($66,000 vs. $49,800) and median household wealth ($83,500 vs. $68,529).
The report is based on analysis of U.S. Census and economic data, and on a new Pew Research survey conducted from Jan. 3 to March 27, 2012, in English and seven Asian languages, among a nationally representative sample of 3,511 Asian Americans. The survey also includes representative samples of the six largest Asian-American country of origin groups – Chinese, Indian, Japanese, Korean, Filipino and Vietnamese – which comprise more than 80% of all Asian Americans.
Among the key findings:
Satisfaction with Life, Country: Asian-American adults are more satisfied than the U.S. general public with their lives overall (82% vs. 75%), with their financial situation (51% vs. 35%) and with the general direction of the country (43% vs. 21%). They are more likely than all U.S. adults to say their lives are better than their parents’ lives were at a comparable age.
Educational Attainment: In 2010, 61% of recent Asian immigrants ages 25 to 64 had a college degree – about double the rate of recent non-Asian immigrants (30%), and nearly double the share of Asian immigrants who arrived three decades ago (35%).

Income, Wealth and Poverty: While there are significant differences across U.S. Asian subgroups, as a whole their median income and household wealth exceed that of average American adults. Asian-American adults are slightly less likely to be poor than all U.S. adults. However, Asian-American poverty rates vary by country of origin. In 2010, Korean, Vietnamese, Chinese and “other Asian” adults (i.e., those who trace their roots to countries other than the top six sending countries) were more likely than U.S. adults overall to be living in poverty.
U.S. Offers a Better Life: On a wide range of dimensions, Asian Americans say conditions in the U.S. are better than those in their country of origin. By lopsided margins they prefer the U.S. for its economic opportunity, political and religious freedom, treatment of the poor and conditions for raising children. There is no consensus on where moral values are superior, and most believe family ties are stronger in their countries of origin. Even in the face of tough economic times here in the U.S., a large majority of Asian immigrants say if they had to do it all over again they would still come to America.
High Value Placed on Marriage, Parenthood: A majority of Asian Americans (54%) say having a successful marriage is one of the most important things in their life, compared with 34% of all American adults who say the same. Two-thirds say being a good parent is one of the most important things in life, compared with half of all U.S. adults. Asian Americans are more likely than all U.S. adults to be married, and their children are more likely than all U.S. children to live with two married parents. Asian Americans also value a long-lasting parental influence: 66% say parents should have at least some influence over their child’s choice of career or profession and nearly as many (61%) say parents should have “a lot” or “some” influence over the choice of a spouse.
“Tiger” Parenting: Many Asian Americans (39%) say parents from their country of origin put too much pressure on their children to do well in school, though a plurality (49%) say parents from their group put about the right amount of pressure on their children. Just 9% say Asian-American parents don’t put enough pressure on their children. Their evaluation of most American parents is quite different: More than six-in-ten (62%) Asian Americans say American parents in general do not put enough pressure on their children to do well in school.
Hard Work: Some 57% of Asian Americans say that Americans as a whole are a very hardworking people. But fully 93% say the same about their own country of origin group.
High Rates of Intermarriage: Asian-American newlyweds are more likely than any other major racial or ethnic group to have married someone outside of their race or ethnicity. Between 2008 and 2010, 29% of all Asian newlyweds married someone of a different race, compared with 26% of Hispanics, 17% of blacks and 9% of whites.
Getting Along with Other Groups: Almost nine-in-ten (87%) survey respondents say their U.S. Asian subgroup gets along “very” or “pretty” well with whites; 72% say the same for Hispanics and 63% say that for blacks. There are differences across subgroups. Koreans stand out for their negative views of their group’s relations with blacks; half describe these groups’ relations as poor.
Discrimination: Relatively few Asian Americans (13%) say they view discrimination against their group as a major problem, while about half say it is a minor problem and about a third say it is not a problem. About one-in-five say they have personally been treated unfairly in the past year because they are Asian, but majorities say their heritage makes no difference when it comes to finding a job or getting into college.
Identity and Language: A majority (62%) say they identify themselves most often using their country of origin (e.g. Vietnamese or Vietnamese American). Relatively few (19%) most often use the broad “Asian” or “Asian-American” label to describe themselves, and only 14% most often describe themselves simply as “American.” Just 39% of all Asian Americans think of themselves as “typical Americans,” not surprising among a group in which nearly three-in-four adults are foreign born. Among U.S.-born Asian Americans, 65% describe themselves as “typical Americans.” About half (53%) of Asian-American immigrants say they speak English very well; this share rises to 95% among the U.S. born.
Political Views: Most Asian Americans say they would prefer a bigger government that provides more services to a smaller government that provides fewer services (55% vs. 36%). Among the general public, the balance of opinion runs the other way: 39% prefer a bigger government while 52% would choose a smaller government. Half of all Asian Americans identify with or lean toward the Democrats, while 28% identify with or lean toward the Republicans. The general public divides more evenly between the two parties: 49% Democrat/lean Democratic and 39% Republican/lean Republican. A narrow majority of Asian Americans (54%) approve of the way Barack Obama is handing his job as president, while 29% disapprove. The public’s views of Obama are more negative: 44% approve vs. 48% disapprove.
Unauthorized Immigrants. Unauthorized Asian Americans account for about 10-11% of the U.S. unauthorized-immigrant population, and about 13-15% of the Asian immigrant population during the 2000-2010 decade, according to a Pew Research analysis of government data. (By contrast, Hispanic unauthorized immigrants account for about three-quarters of the U.S. unauthorized population and about 45% of Hispanic immigrants.)
View the full report, along with interactive maps and an infographic of key findings, at http://www.pewsocialtrends.org/asianamericans.
The report will be presented in Washington at an event featuring Pew Research experts and Asian American leaders and scholars. To view the webcast at 9:30 a.m. EDT, go to http://www.pewsocialtrends.org/asianamericans-video/.
About Pew Research Center: Pew Research Center is a nonpartisan fact tank that provides information on the issues, attitudes and trends shaping America and the world. The center conducts public opinion polling, demographic studies, media content analysis and other empirical social science research. It does not take positions on policy issues. It is a subsidiary of The Pew Charitable Trusts, its primary funder.


